Intel® Xeon® Scalable Processors, starting from the 4th Generation (codenamed Sapphire Rapids), feature accelerators, which include the Intel® In-Memory Analytics Accelerator (Intel® IAA), Intel® Data Streaming Accelerator (Intel® DSA), and Intel® QuickAssist Technology (Intel® QAT), among others. These accelerators are essential components that can enhance the performance of Intel architecture platforms.
Although these accelerators and their associated software stacks can significantly contribute to data center system performance, customers and users often find it challenging to access and understand performance data such as utilization and throughput. This difficulty arises from the complexity of low-level hardware event sets, which require a deep understanding of the accelerator's hardware and software architecture.
The pcm-accel tool addresses this challenge by sampling performance data from the accelerator hardware and presenting it to end users in an easy-to-understand format. Its goal is to enable users to quickly and accurately gain a high-level overview of performance or identify issues related to the accelerator, regardless of their level of expertise in the underlying technology.
pcm-accel [target] [options]
Notes: only 1 target is allowed to monitor.
| target | Default | Description |
|---|---|---|
| -iaa | yes | Monitor the IAA accelerator. |
| -dsa | no | Monitor the DSA accelerator. |
| -qat | no | Monitor the QAT accelerator. |
Notes: multiple options is allowed.
| options | Default | Description |
|---|---|---|
| -numa | no | Print NUMA node mapping instead of CPU socket location. |
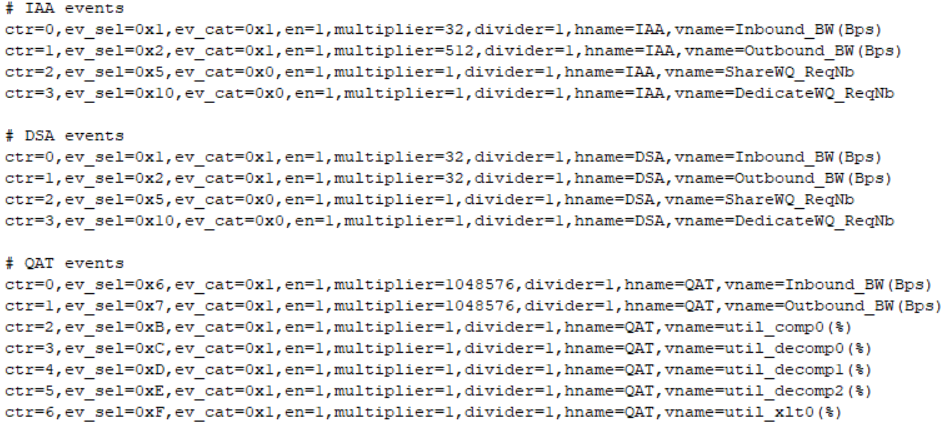
| -evt=[cfg.txt] | opCode-x-y-accel.txt | Specify the event config file name as cfg.txt. - x/y is cpu family is model id, for example 6/143 for Sapphire Rapids. |
| -silent | no | Silence information output and print only measurements |
| -csv[=file.csv] | no | Output compact CSV format to screen or a file in case filename is provided |
| -csv-delimiter=[value] | no | Set custom csv delimiter |
| -human-readable | no | Use human readable format for output (for csv only) |
| -i=[value] | 0 | Allow to determine number of iterations, default is 0(infinite loop) if not specified. |
| [interval] | 3 | Time interval in seconds (floating point number is accepted) to sample performance counters, default is 3s if not specified |
This example prints IAA counters every second 10 times and exits
pcm-accel -iaa 1.0 -i=10
This example saves IAA counters twice a second save IAA counter values to test.log in CSV format
pcm-accel -iaa 0.5 -csv=test.log
This example prints IAA counters every 3 second in human-readable CSV format
pcm-accel -iaa -csv -human-readable
Linux* OS:
FreeBSD* OS:
Windows OS:
- Install and load the required accelerator driver(iaa/dsa, qat driver, etc).
Notes:
- QAT monitoring and NUMA node display feature is supported only on Linux OS!
Common indicator(Column field):
- Accelerator = Accelerator device id.
- Socket = CPU socket id where accelerator device is located.
- NUMA Node = NUMA node that accelerator device belongs to.
- Inbound_BW = Data throughput input to the accelerator device, unit is Bps(Bytes per second).
- Outbound_BW = Data throughput output from the accelerator device, unit is Bps(Bytes per second).
Specific indicators related to IAA/DSA:
- ShareWQ_ReqNb = The number of request submitted to share work queue of accelerator.
- DedicateWQ_ReqNb = The number of request submitted to dedicate work queue of accelerator.


Specific indicators related to QAT:
-
util_comp0 = The utilization of the compress engine 0, unit is %.(Sapphire Rapids platform has 1 compress and 3 decompress engine per QAT device)
-
util_decomp0 = same as above for decompress engine 0.
-
util_decomp1 = same as above for decompress engine 1.
-
util_decomp2 = same as above for decompress engine 2.
-
util_xlt0 = same as above for translation engine 0.

pcm-accel tool allows the user to customized the monitored performance events with the config file as advance feature.
Customize fields of cfg file:
- ev_sel and ev_cat field for IAA/DSA monitor event.
- ev_sel field for QAT monitor event.
- multiplier/divider is for event data display calculation.
- vname is the event name string(column) displayed in the UI.
Please refer to the spec or code to learn more about the event mapping if you want to customize it.
-
QAT: please refer to the mapping table in source code
Here is the content of the event cfg file(opCode-6-143-accel.txt as example)